Texas Veteran Owned Business Numbers
The following is a statistical look at veteran owned small businesses (VOSB) and service disabled veteran owned small business (SDVOSB) numbers in the state of Texas.
| GEOGRAPHICAL AREA | ALL FIRMS | VETERAN OWNED (at least 51%) |
50% VETERAN OWNED / 50% NON-VETERAN OWNED |
| UNITED STATES | 27,110,362 | 2,449,477 | 1,220,841 |
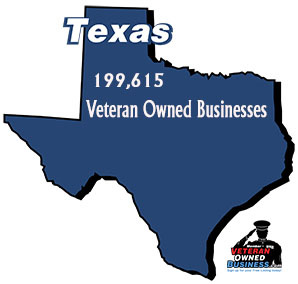
| Texas | 2,166,131 | 199,615 | 112,208 |
| Percentage of U.S. | 8% | 8.2% | 9.2% |
| Percentage of VOSB / SDVOSB Texas businesses: | 9.2% | 5.2% | |
| TX: 9.2% vs. the national state average: 9.04% | +.16% (1.8% Higher) | ||
Interesting facts about businesses owned by veterans in Texas:
Texas currently represents 8% of the total businesses in the United States and 8.2% of the total Veteran Owned Businesses in the United States.
9.2% of the total number of businesses in Texas are majority-owned (51%+) by veterans which is roughly 2% (+.16%) higher than the national state average of 9.04%.
View the entire national statistics list of Veteran Owned Businesses in the United States.
Click here to view our entire list of Veteran Owned Businesses and/or Service Disabled Veteran Owned Businesses in Texas including our directory of veteran owned businesses in Texas broken down by counties, cities and categories.
This statistics shows how many Veteran Owned Small Businesses (VOSB) or Service Disabled Veteran Owned Small Businesses (SDVOSB) are located in Texas. For more information about these statistics contact Veteran Owned Business at (877) 862-5478 or email us at [email protected].


")